
The Basic Refrigeration Circuit, Pressure & Enthalpy w/ Carter Stanfield (Podcast)
Make & share a podcast clip
Keep the exact passage and a link to the full episode. Choose up to three minutes, with enough context to be fair to the speaker.
Preview uses this episode’s audio. Browser audio export, when supported, takes the length of the selected clip. Nothing plays until you choose Preview.
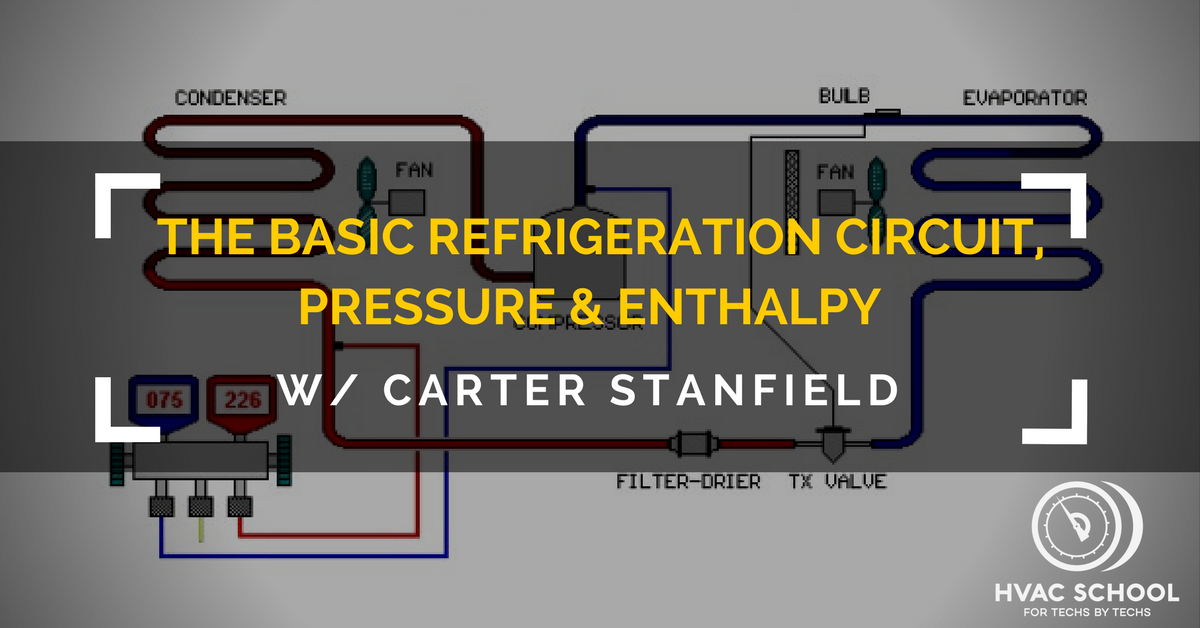
Carter Stanfield, a co-author of Fundamentals of HVACR, talks about the entire refrigeration circuit. He also explains how to read and plot a pressure-enthalpy diagram.
The refrigeration circuit has four main components: evaporator, compressor, condenser, and metering device. When teaching, Carter likes to explain that boiling is a cooling process and condensation is a heating process. He describes saturation as the breaking point at which liquid refrigerant can no longer hold more heat (in the evaporator). The superheated vapor from the suction line then enters the compressor; the compressor adds even more superheat. So, the discharge line has very superheated vapor. In the condenser, saturation occurs when the vapor cools to the point that it can no longer hold more moisture; the temperature stays the same until the refrigerant becomes entirely liquid. Subcooled liquid travels to the metering device via the liquid line. The metering device reduces the pressure of the refrigerant and feeds the evaporator. However, some flash gas occurs and helps drop the temperature of the remaining liquid.
A pressure-enthalpy diagram illustrates the refrigerant’s changes in and out of the saturated state as it moves through the refrigeration circuit. The chart looks like a curved dome, and saturated states are inside the dome. Pressure is on the y-axis, and enthalpy is on the x-axis. Pressure is a logarithmic arrangement; a linear arrangement would be impossible to plot. The bottom of the chart shows low pressures, and the top shows high ones. Enthalpy is the heat content of the refrigerant. We express it in BTUs/lb.
When you plot one of these diagrams, you can start with four lines and readings: high and low-side pressure, suction line temperature into the compressor, and liquid line temperature into the metering device. You will end up drawing a parallelogram shape on the chart.
If you have an iPhone, subscribe to the podcast HERE, and if you have an Android phone, subscribe HERE.
Highlight a short passage, or bring a question about a specific moment into HVAC No Bull Forum.
Discuss this reference → Related forum discussions










Comments
To leave a comment, you need to log in.
Log In