This is the first of a three-part series of articles that will dive deep into advanced psychrometrics. The source material for each of these articles may be found in ACCA Manual P Sections 3, 4, and 5. This article is based on information found in Section 3.
Psychrometrics is the study of the physical and thermodynamic properties of gas-vapor mixtures. In HVAC/R, we are specifically interested in air-moisture mixtures and how varying properties affect human comfort and equipment performance. A psychrometric chart is a tool used to describe all the possible combinations of gas-vapor mixtures. It can be used to calculate the sensible and latent loads associated with HVAC/R equipment.Using a psychrometric chart can be a bit confusing at first. However, with practice and familiarity with the formulas, a psych chart can be easily used for a wide variety of purposes. You can find basic psychrometric education in the Refrigeration and Air Conditioning Technologies Manual (RACT) and the first two sections of ACCA Manual P. However, in this article, I’m going to show you how you can apply psychrometrics to calculate design room CFM and illustrate how psychrometry can be used to help a technician understand supply air properties. All of the information discussed here can be found in Section 3 of ACCA Manual P.
When selecting equipment for a home or building, it is recommended a room-to-room heat load calculation be done as opposed to a block load calculation (Wrightsoftis an excellent software for load calculations, just saying). Room-to-room calculations result in a more accurate representation of the heat gains and losses per zone (room). They can also greatly improve the accuracy and performance of system sizing and design. Assuming a room-to-room load calculation has been done on a building, the next step in utilizing the psychrometric chart would be to plot out the room sensible heat ratio lines for each zone. Room sensible heat ratio (RSHR) is the ratio of sensible heat to total heat (including latent) for a room (or zone). If, for example, a room had a total heat load of 2,500 BTU/h and 1,800 BTU/h sensible heat, the RSHR would be 0.72.
RSHR = Room Sensible Load ÷ Room Total Load
RSHR = 1,800 BTUh ÷ 2,500 BTUh
RSHR = 0.72
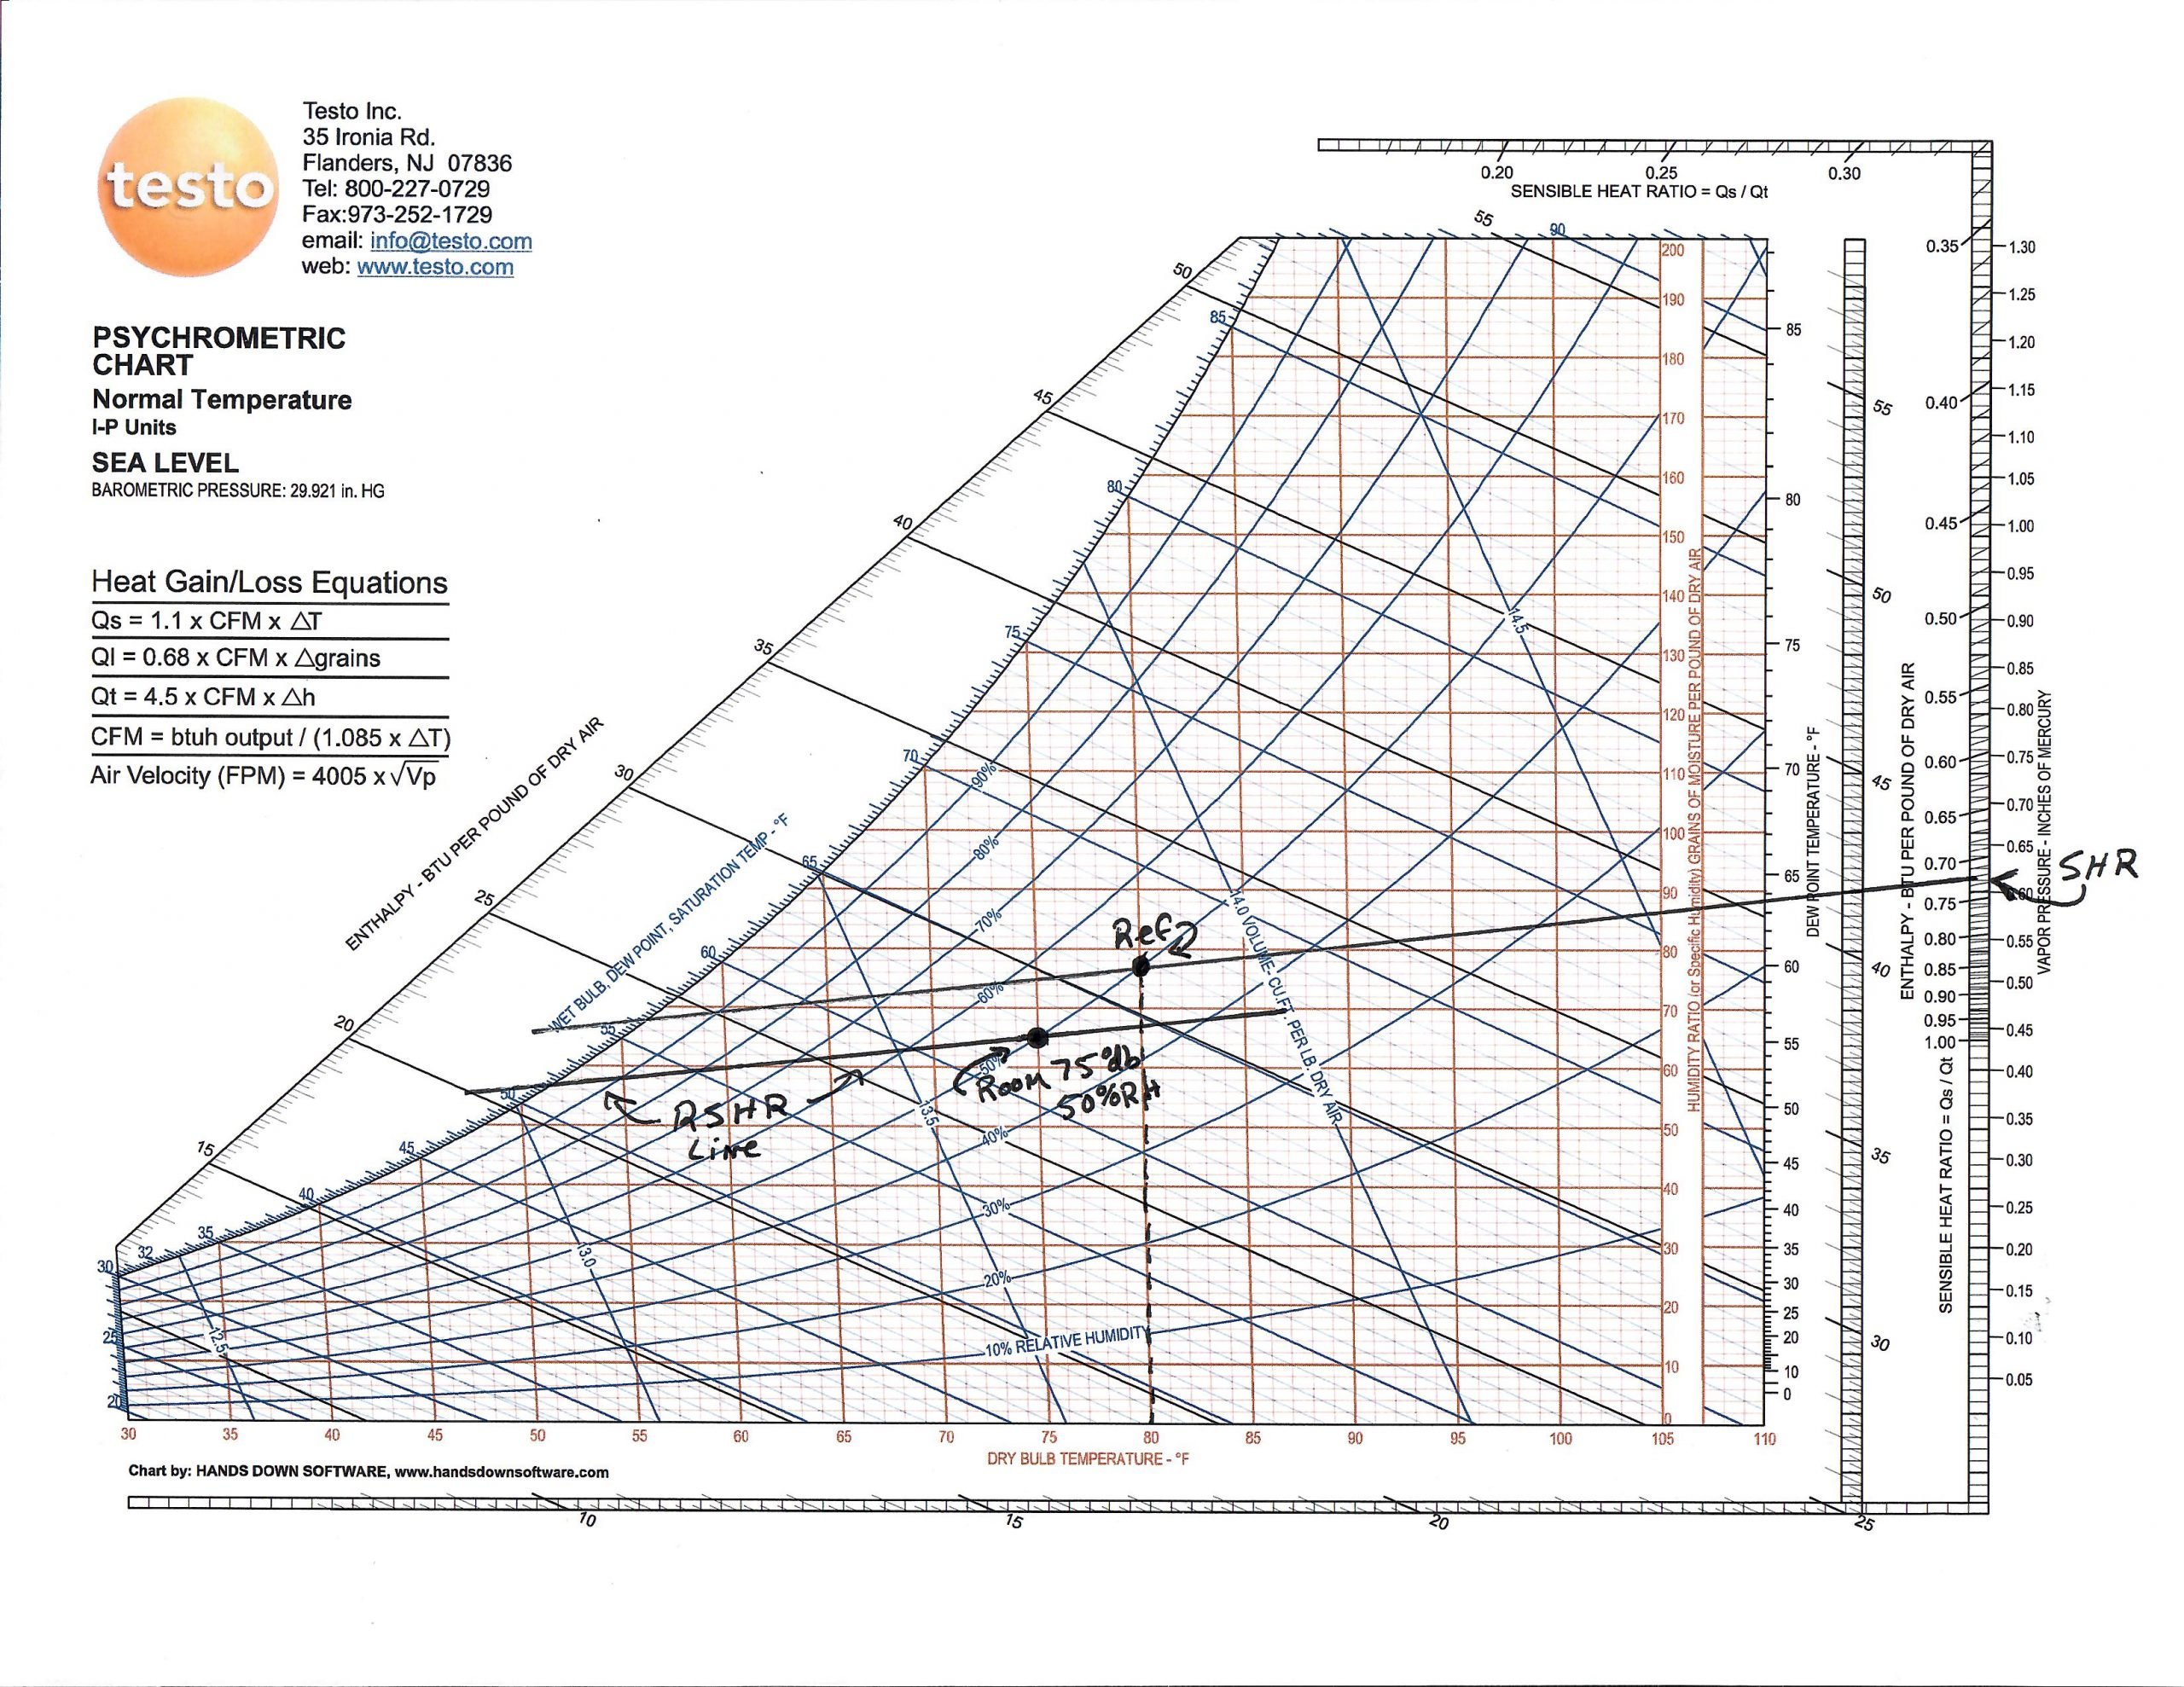
Now that we know the RSHR, it’s time to plot the RSHR line on the psych chart. To do this, we need to find a “reference dot.”
80℉ dry-bulb (DB) at 50% relative humidity (RH) is considered the standard reference dot. Locate and mark the reference dot and then run a line through the reference dot using a straight edge lined up with the RSHR (0.72), which can be found on the far right-hand side of the chart.
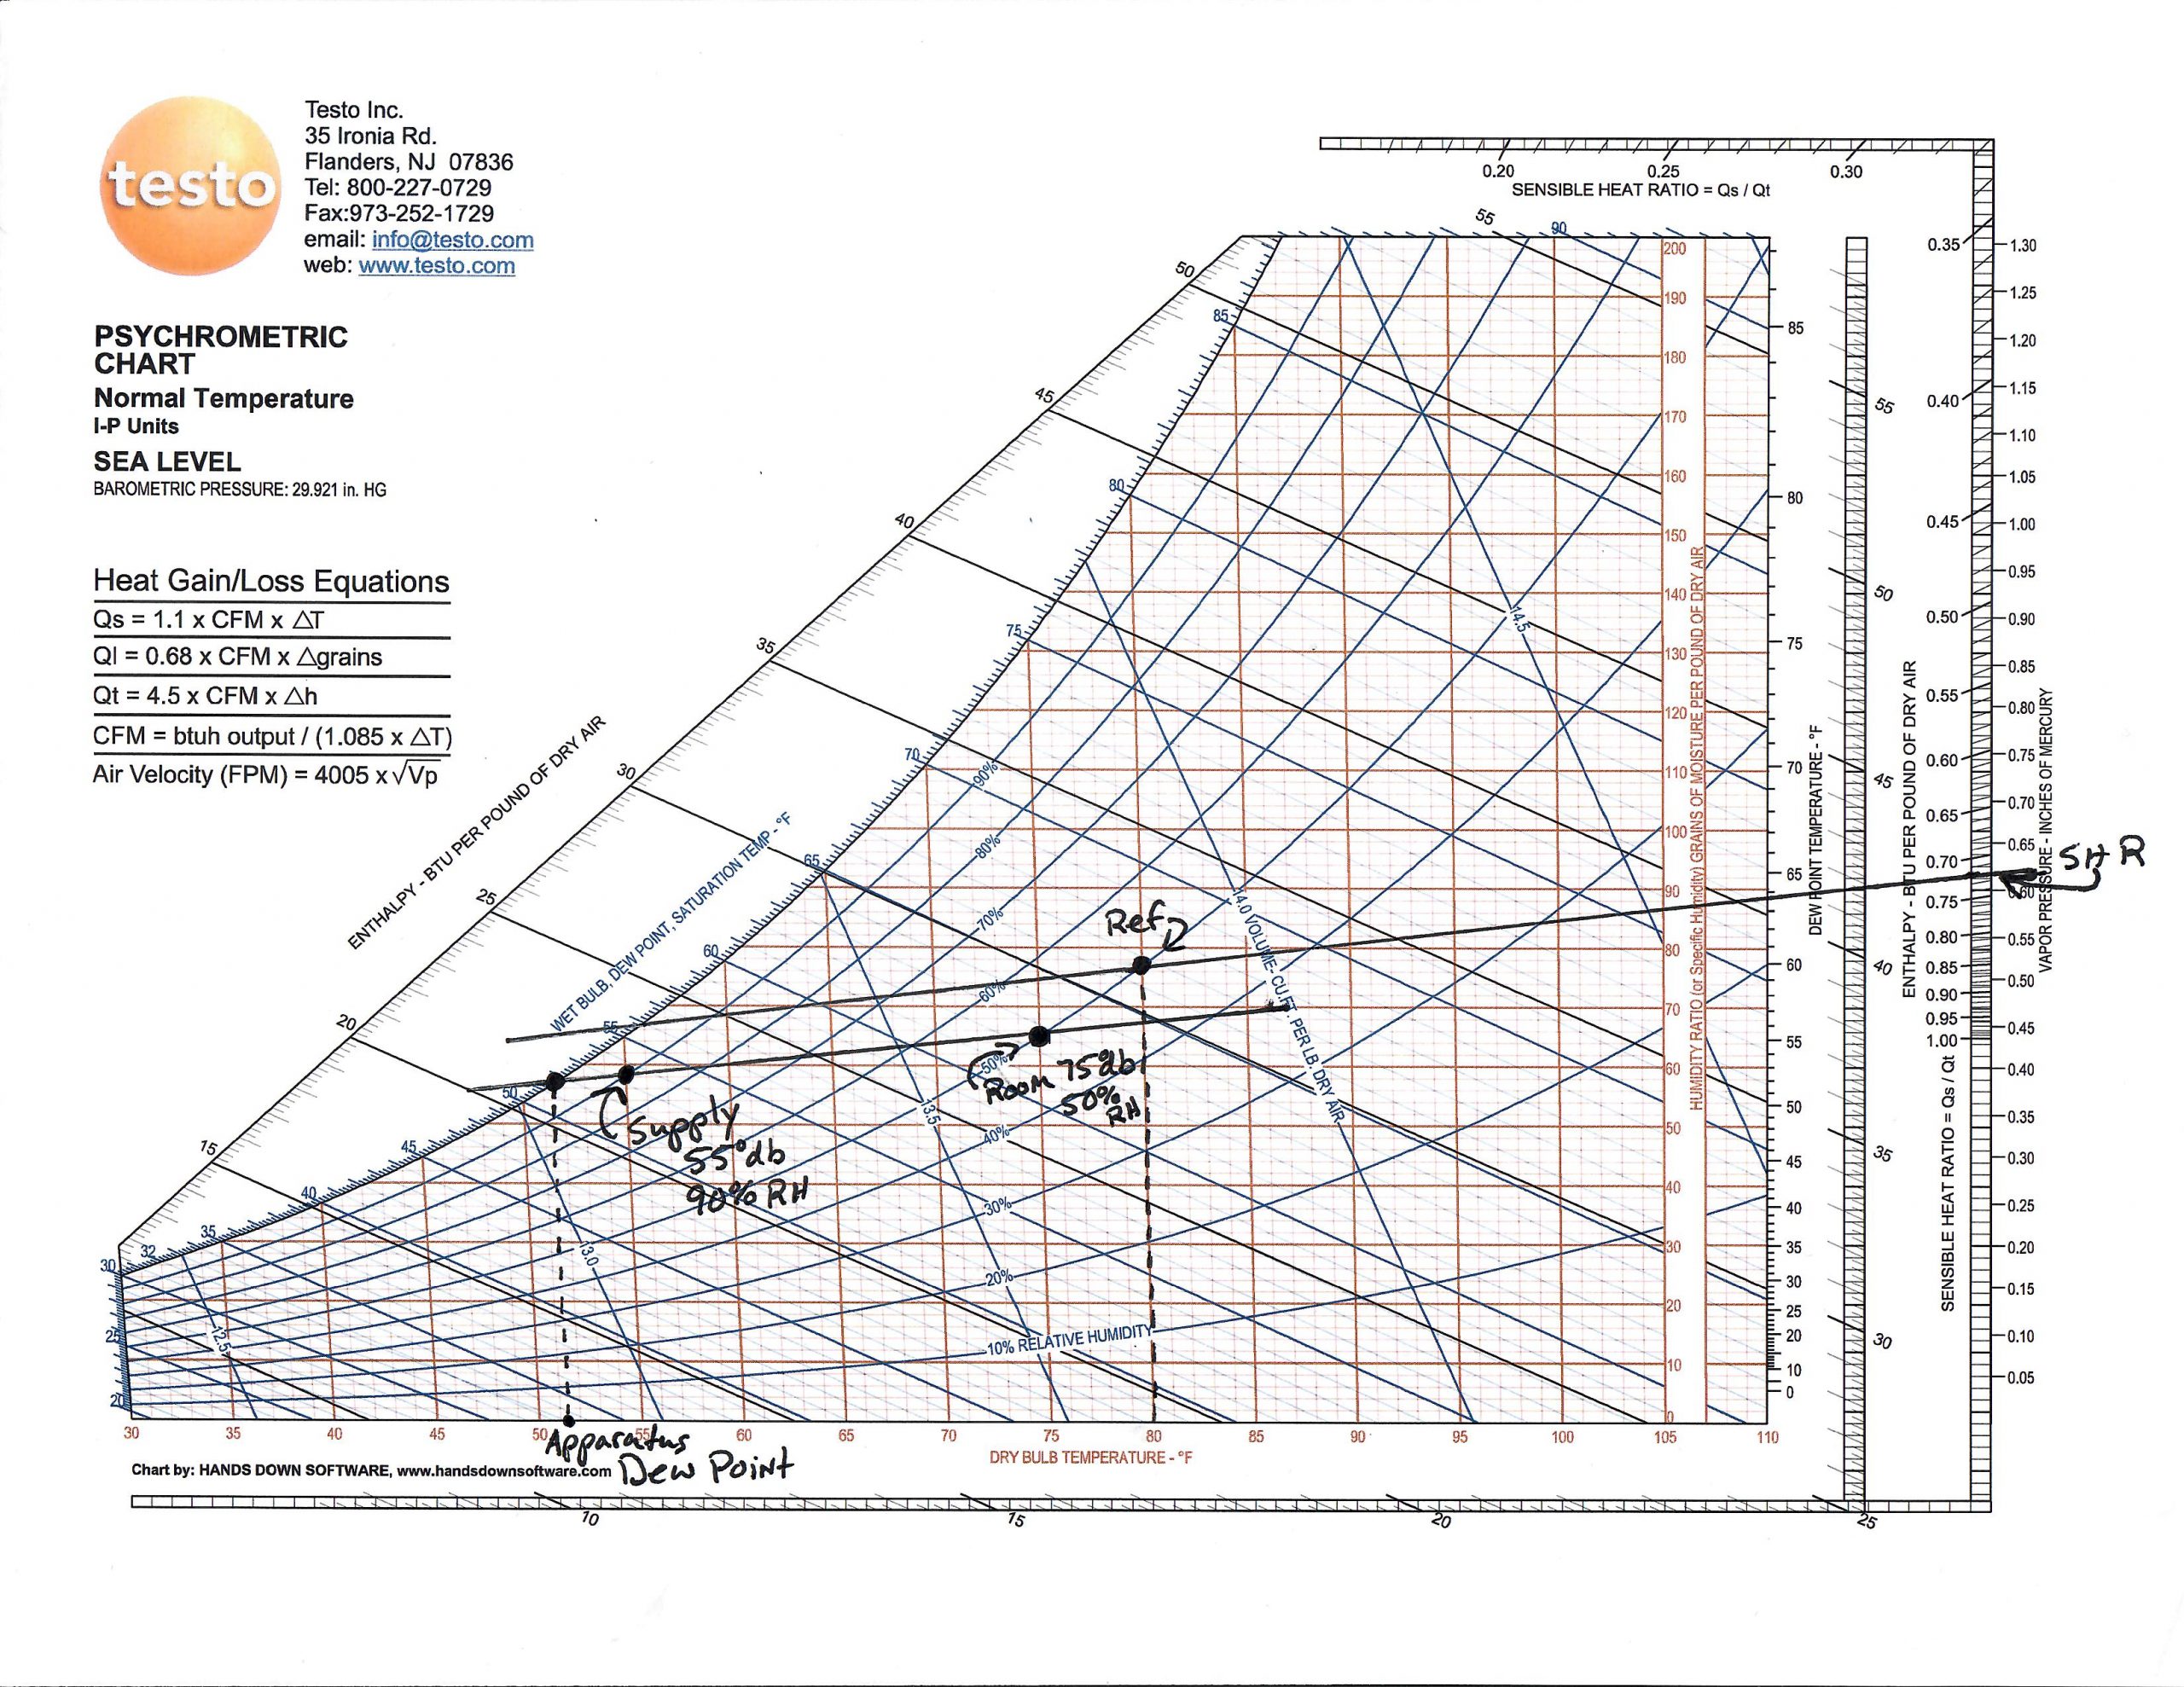
Now, locate the design conditions for the zone in question. Let’s say the design condition (on a design day of 90℉) is 75℉ DB at 50% RH. You would plot that dot on the chart. Then, run a line straight through that dot heading to the left of the chart, making sure it is parallel to the reference line. This line is your RSHR line. You may now use this line to select a supply air condition that will maintain the design room condition on a design day. However, the supply air condition must fall somewhere between the design room condition and dew point (about 51.5℉ in this example). Theoretically, the lowest possible supply air condition would involve the evaporator coil in cool mode to be 51.5℉ (dew point), and the supply air leaving the register to be the same. However, this theory is in no way practical when you consider duct gains, air leakage, and bypass factors (let alone the fact no one wants a sweaty supply register). Practically, a supply condition falling somewhere between 80%-95% RH will result in good dehumidification, lower airflow, and low fan power consumption.
Select a supply temperature condition. For this example, let’s choose 55℉ at 90% RH. The next step is to calculate the design room CFM. The equation for CFM is as follows:
CFM = Room Sensible Load ÷ (1.08 x ΔT)
Remember, the sensible load for this zone is 1,800 BTU/h. The difference between the room condition and the supply air condition is 20℉.
CFM = 1,800 BTU/h ÷ (1.08 x 20℉)
CFM = 83
The required volume of air given an hour of the runtime is 83 CFM for this room to maintain the design room air condition under design load.
But what if my ΔT is lower?
Then, the required volume of air increases. The new supply air condition is 63℉ at 72% RH, giving us a ΔT of 12℉.
CFM = 1,800 BTU/h ÷ (1.08 x 12℉)
CFM = 139
Both of the different supply air selections will maintain the design room condition on a design day because they each fall on the RSHR line. But as the temperature difference between return and supply air decreases, the required CFM increases. What is 1.08 supposed to be?That is the product of the following equation:
Runtime (minutes) x Isobaric Air Density x Isobaric Specific Heat of Air
60 x 0.075 x 0.24 = 1.08
I must address some caveats regarding this formula, and I credit Alex Meaney with Wrightsoft and Genry Garcia with Comfort Dynamics, Inc. for helping me understand these complexities. Both gentlemen are brilliant-minded experts in their fields and have contributed (and continue to contribute) to HVAC School.First, the runtime is specified in minutes—because we are solving for cubic feet per minute (CFM)—but also using British Thermal Units per hour. Converting the hour of runtime to minutes gives us 60 minutes and ensures that our units of measurement are compatible.Second, you may notice the term isobaric. This refers to any property at a constant pressure. At sea level, atmospheric pressure is around 14.7 PSIA. At this presumed fixed pressure, the density of dry air is 0.075 lb/ft3, and the specific heat of dry air is 0.24 BTU/lb/℉.
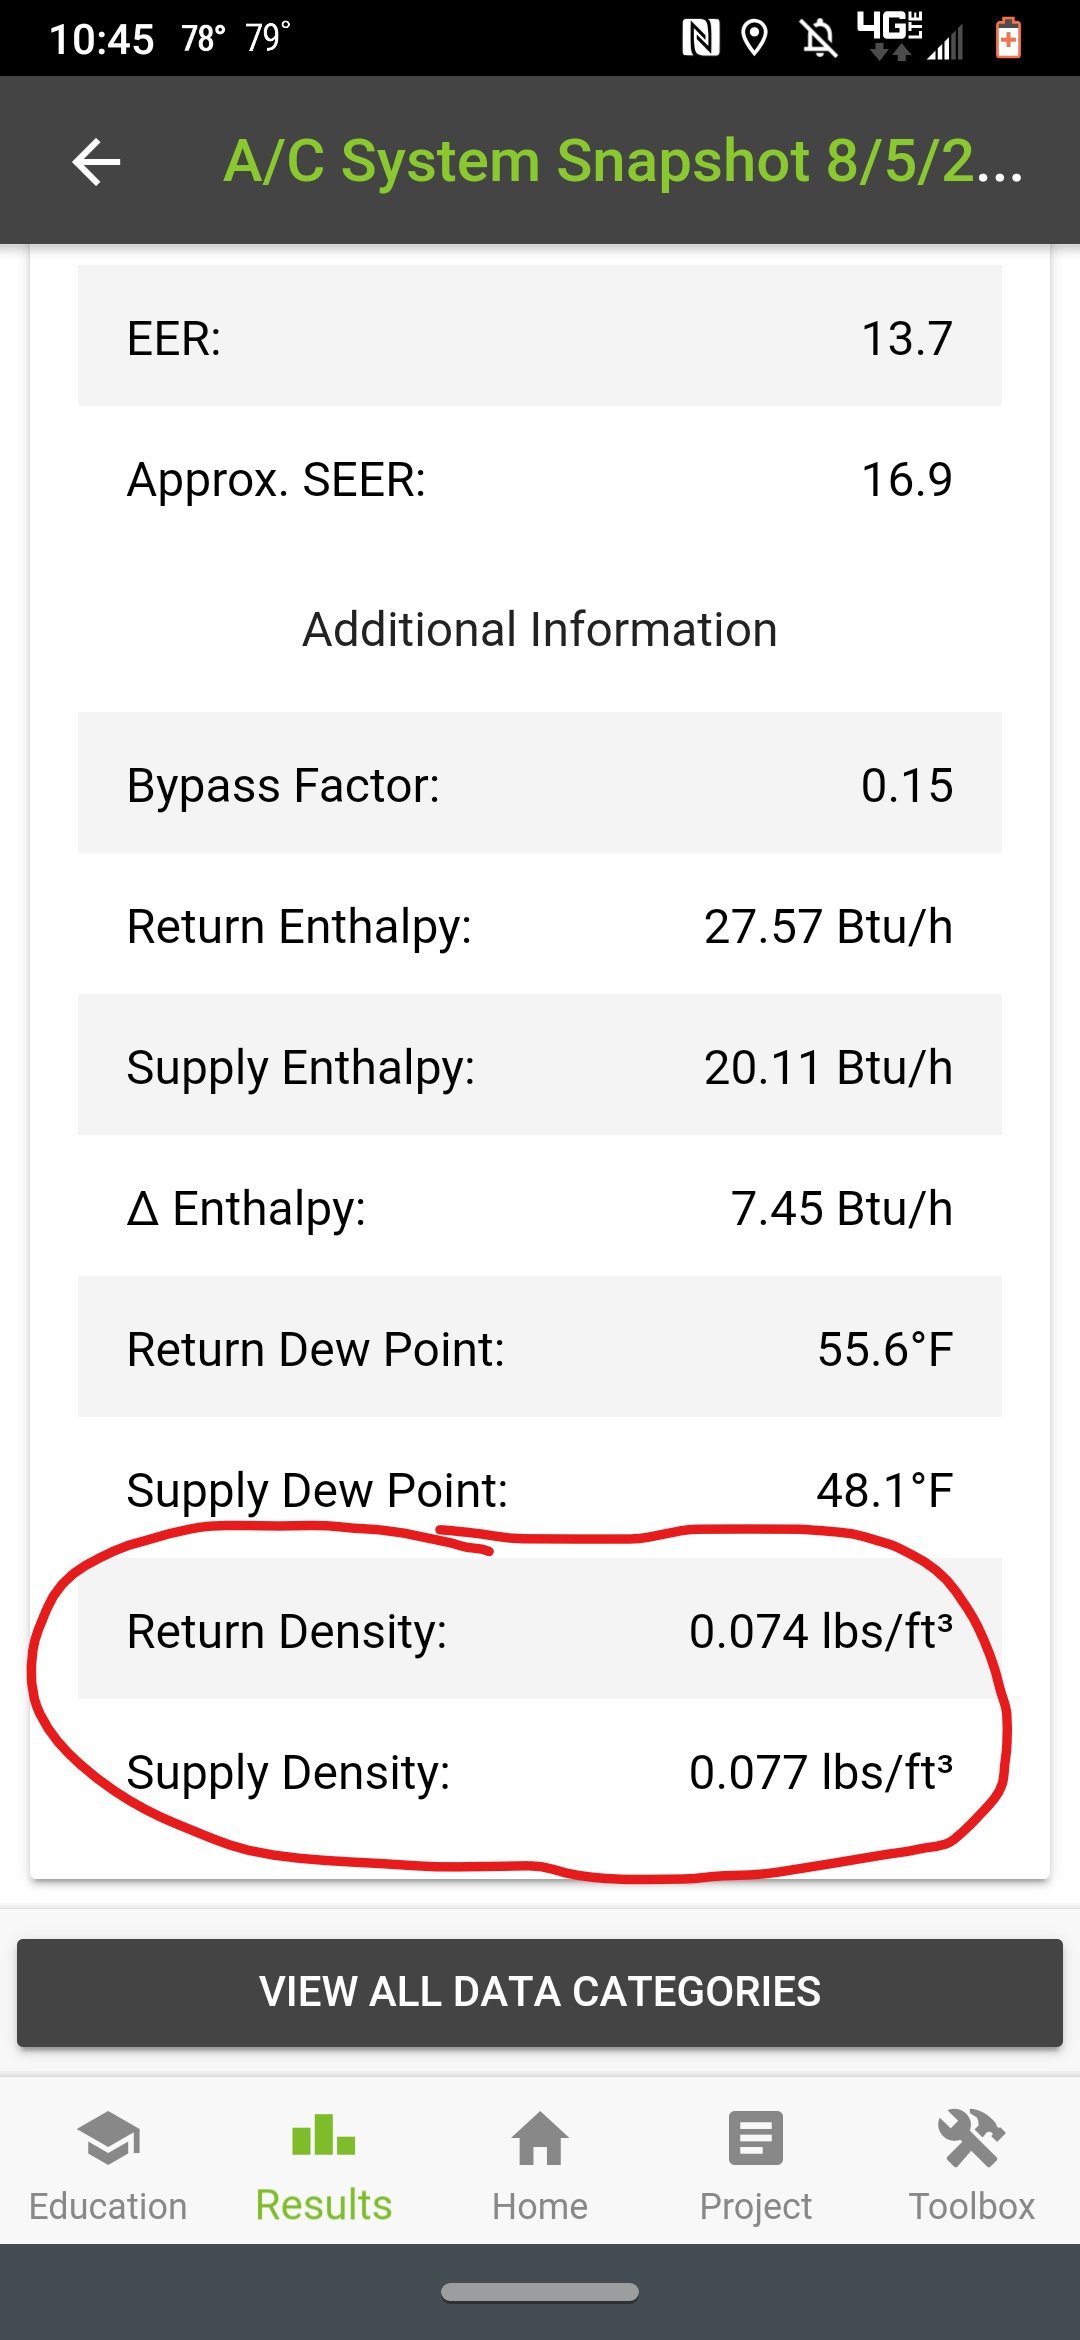
In reality, atmospheric pressure is not fixed, and outdoor air is not always dry. While you may be able to correct for actual pressure and humidity, it may not always be practical. On the other hand, with the ability to use MeasureQuick (which corrects for air density and pressure in its calculations), the processes discussed in these articles may become more practical. It is important to note that manufacturers use isobaric air density and specific heat in their capacity ratings and airflow calculations. Therefore, the argument could also be made that even with this caveat, the end result will (on average) still land you nominally close to the actual air condition requirements.(Please note the wording used here. 😉) So, how does this all circle back to practical application? We must understand that a coil can operate in only one sensible heat ratio at a time, and it may not equate to any of the RSHRs calculated for any particular zone. In the case of a home with multiple zones, you may choose one of the following options when selecting a cooling coil to match the load conditions:
If humidity control is critical to a specific zone, use the RSHR for that room to select a coil. All other rooms will vary in humidity, but the critical zone will be maintained.
Average all the RSHRs together for a mean RSHR that can be used to select a coil. Each room will vary slightly from its individual RSHR, but it will be minimal and likely unnoticeable.
And that, in a nutshell, is how you may use a psychrometric chart and data from a load calculation to determine room design CFM. This exercise, however, merely scratches the surface of the many factors that must be considered in an HVAC system. This exercise works only for a system that does not suffer from duct leakage or bypass factor and has no ventilation whatsoever for the home/building. This exercise would fall short of providing any real-world insight into psychrometric properties involving an HVAC system. However, the skills learned here translate into the next phase of advanced psychrometrics! In the next two articles, I will detail how these variables can be accounted for (even solved for). In the end, I hope you will understand a little more about psychrometrics in general and how to add that knowledge to your ability to efficiently diagnose a system as a whole (including the envelope and people).I’ll end this article with a quote from Alex Meaney. I think it is important to keep this idea in mind throughout the rest of this series of articles:
“I’m of the opinion that local humidity is usually a[n] infiltration/ventilation/return problem, not a supply problem.”
—Alex Meaney
For access to the Testo Psych Chart I used for this article, click here.—Kaleb
The HVAC School site, podcast, and tech tips are
made possible by generous support from
Cookie Consent
We use essential cookies to keep HVAC School working. With your permission, we also use optional cookies for analytics, marketing, and embedded content. Choose Accept All, Reject All, or Preferences. You can change your choice at any time using Cookie Settings.
Cookie Preferences
Essential cookies are always active. Optional cookies stay off until you choose to enable them. You can change or withdraw your consent at any time using Cookie Settings.
Essential cookies enable basic functions and are necessary for the proper function of the website.
Name
Description
Duration
Cookie Preferences
This cookie is used to store the user's cookie consent preferences.
30 days
These cookies are needed for adding comments on this website.
Name
Description
Duration
comment_author
Used to track the user across multiple sessions.
Session
comment_author_email
Used to track the user across multiple sessions.
Session
comment_author_url
Used to track the user across multiple sessions.
Session
These cookies are used for managing login functionality on this website.
Name
Description
Duration
wordpress_logged_in
Used to store logged-in users.
Persistent
wordpress_sec
Used to track the user across multiple sessions.
15 days
wordpress_test_cookie
Used to determine if cookies are enabled.
Session
Statistics cookies collect information anonymously. This information helps us understand how visitors use our website.
Google Analytics is a powerful tool that tracks and analyzes website traffic for informed marketing decisions.
Contains information related to marketing campaigns of the user. These are shared with Google AdWords / Google Ads when the Google Ads and Google Analytics accounts are linked together.
90 days
__utma
ID used to identify users and sessions
2 years after last activity
__utmt
Used to monitor number of Google Analytics server requests
10 minutes
__utmb
Used to distinguish new sessions and visits. This cookie is set when the GA.js javascript library is loaded and there is no existing __utmb cookie. The cookie is updated every time data is sent to the Google Analytics server.
30 minutes after last activity
__utmc
Used only with old Urchin versions of Google Analytics and not with GA.js. Was used to distinguish between new sessions and visits at the end of a session.
End of session (browser)
__utmz
Contains information about the traffic source or campaign that directed user to the website. The cookie is set when the GA.js javascript is loaded and updated when data is sent to the Google Anaytics server
6 months after last activity
__utmv
Contains custom information set by the web developer via the _setCustomVar method in Google Analytics. This cookie is updated every time new data is sent to the Google Analytics server.
2 years after last activity
__utmx
Used to determine whether a user is included in an A / B or Multivariate test.
18 months
_ga
ID used to identify users
2 years
_gali
Used by Google Analytics to determine which links on a page are being clicked
30 seconds
_ga_
ID used to identify users
2 years
_gid
ID used to identify users for 24 hours after last activity
24 hours
_gat
Used to monitor number of Google Analytics server requests when using Google Tag Manager
1 minute
Jetpack's built-in visitor analytics. It records page views, referring sites, search terms, and outbound link clicks, and also carries the shared visitor-tracking library used by Jetpack Instant Search and WooCommerce Analytics.
Registers a unique ID on mobile devices to enable tracking based on geographical GPS location.
1 day
VISITOR_INFO1_LIVE
Tries to estimate the users' bandwidth on pages with integrated YouTube videos. Also used for marketing
179 days
PREF
This cookie stores your preferences and other information, in particular preferred language, how many search results you wish to be shown on your page, and whether or not you wish to have Google’s SafeSearch filter turned on.
10 years from set/ update
YSC
Registers a unique ID to keep statistics of what videos from YouTube the user has seen.
Session
DEVICE_INFO
Used to detect if the visitor has accepted the marketing category in the cookie banner. This cookie is necessary for GDPR-compliance of the website.
179 days
LOGIN_INFO
This cookie is used to play YouTube videos embedded on the website.
Comments
To leave a comment, you need to log in.
Log In