
Get Tech Tips
Subscribe to get free tech tips.
Oscilloscopes 101

This tech tip is the first in a four-part series on using oscilloscopes. I'd like to give a special thanks to Andrew Holden for his contributions to this particular tech tip.
When we want to measure voltage between two points, we reach for a multimeter. A multimeter can tell us the average electrical potential between those points, but it can’t physically show us how voltage changes over time in something like a communicating system. These changes, however small, represent information, and so we refer to them as signals—they’re the “messages” communicating systems send and receive. When service technicians and scientists want to see how voltage changes over time, they reach for oscilloscopes instead.
Oscilloscopes allow us to see how one or more voltages vary over time, even though the changes happen over the course of mere microseconds (millionths of a second). We can think of oscilloscopes as the TVs of electrical waveforms; they display and present the numbers displayed on our multimeters in a slowed-down, two-dimensional moving image. The y-axis (vertical) represents voltage, the x-axis (horizontal) represents time, and the z-axis represents intensity. Oscilloscopes measure everything and play it back extremely slowly to let you see exactly what is being transmitted or measured.
So, your takeaway of oscilloscopes so far should be that they’re fancy television meters with time distortion capabilities, right? Let's keep going, as there is a lot more to cover!

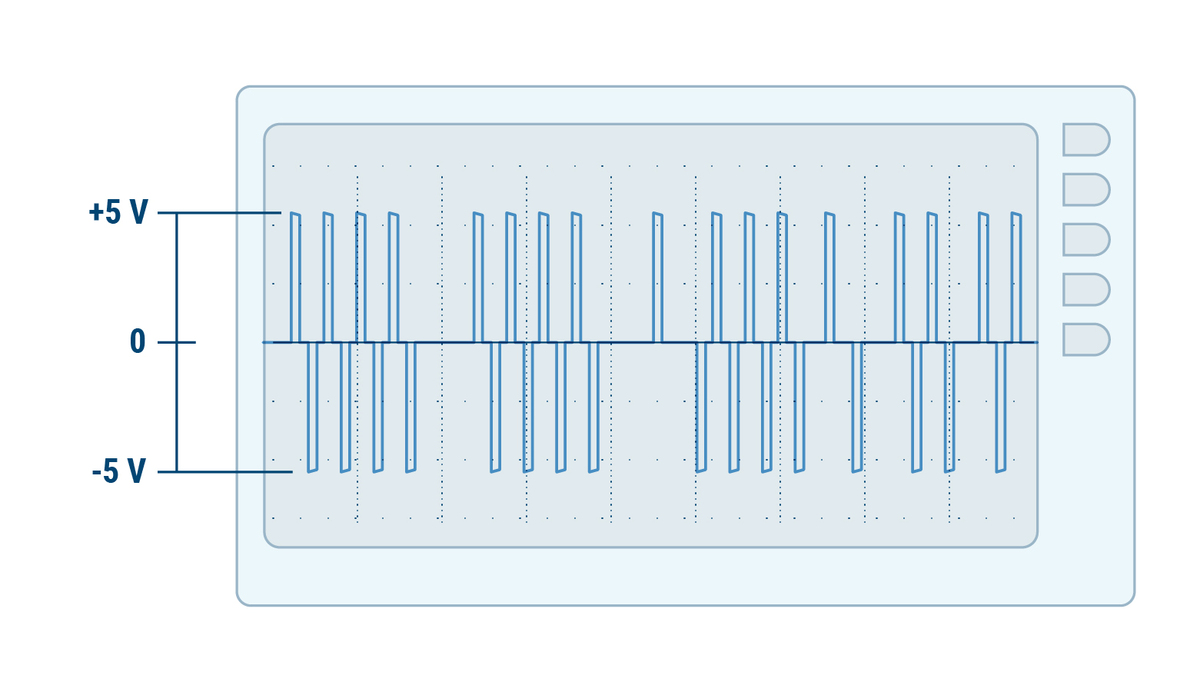
In the world of modern electronics, signals change millions of times per second—if not at fractions of a second. When you plot these changes on an oscilloscope, the graph will take on a distinct shape. This shape is a waveform, and its characteristics can tell you a lot about what is happening over time.
We’ll explore waveforms in greater detail later, but we should first cover the types of oscilloscopes and some basic safety information.
Types of Oscilloscopes
Electronic equipment can fit into two categories: analog and digital. Analog equipment works with continuously variable voltages, while digital equipment works with discrete binary numbers representing voltage samples. A conventional phonograph is an analog device, while a compact disc (CD) player is a digital device.
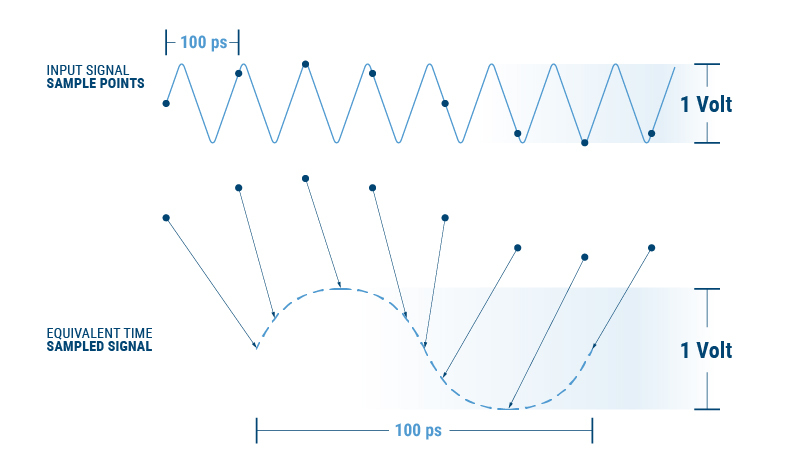
In contrast to an analog oscilloscope, a digital oscilloscope uses an analog-to-digital converter (ADC) to convert the measured voltage into digital information. The digital oscilloscope acquires the waveform as a series of samples and stores them until it accumulates enough samples to describe a waveform. It then reassembles the waveform for the display on the screen.
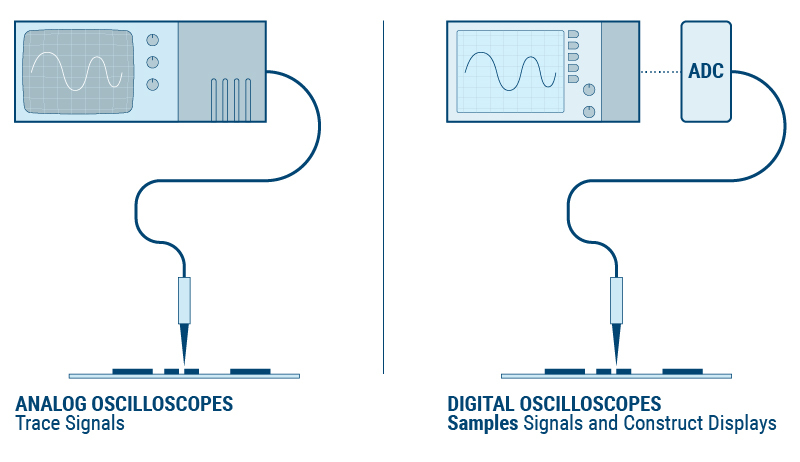
In a nutshell, analog oscilloscopes are great for measuring single-shot or transient events. Digital oscilloscopes are great for picking up repeating signals or those we see in communicating equipment found in HVAC. A digital storage oscilloscope (DSO) is the type of oscilloscope we will discuss in this article. DSOs are ideal for those who need the best general-purpose design and troubleshooting tool for a wide range of applications.
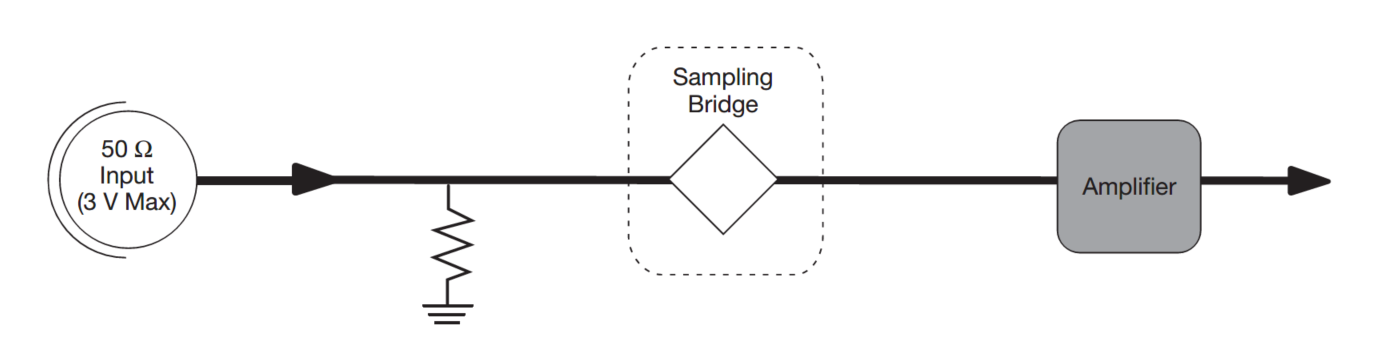
The architecture of a digital sampling oscilloscope.
Oscilloscope Safety
A typical oscilloscope probe looks like this:
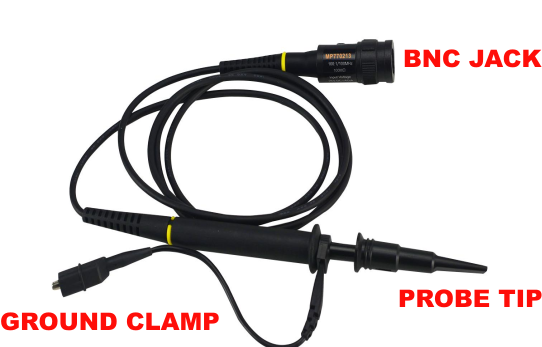
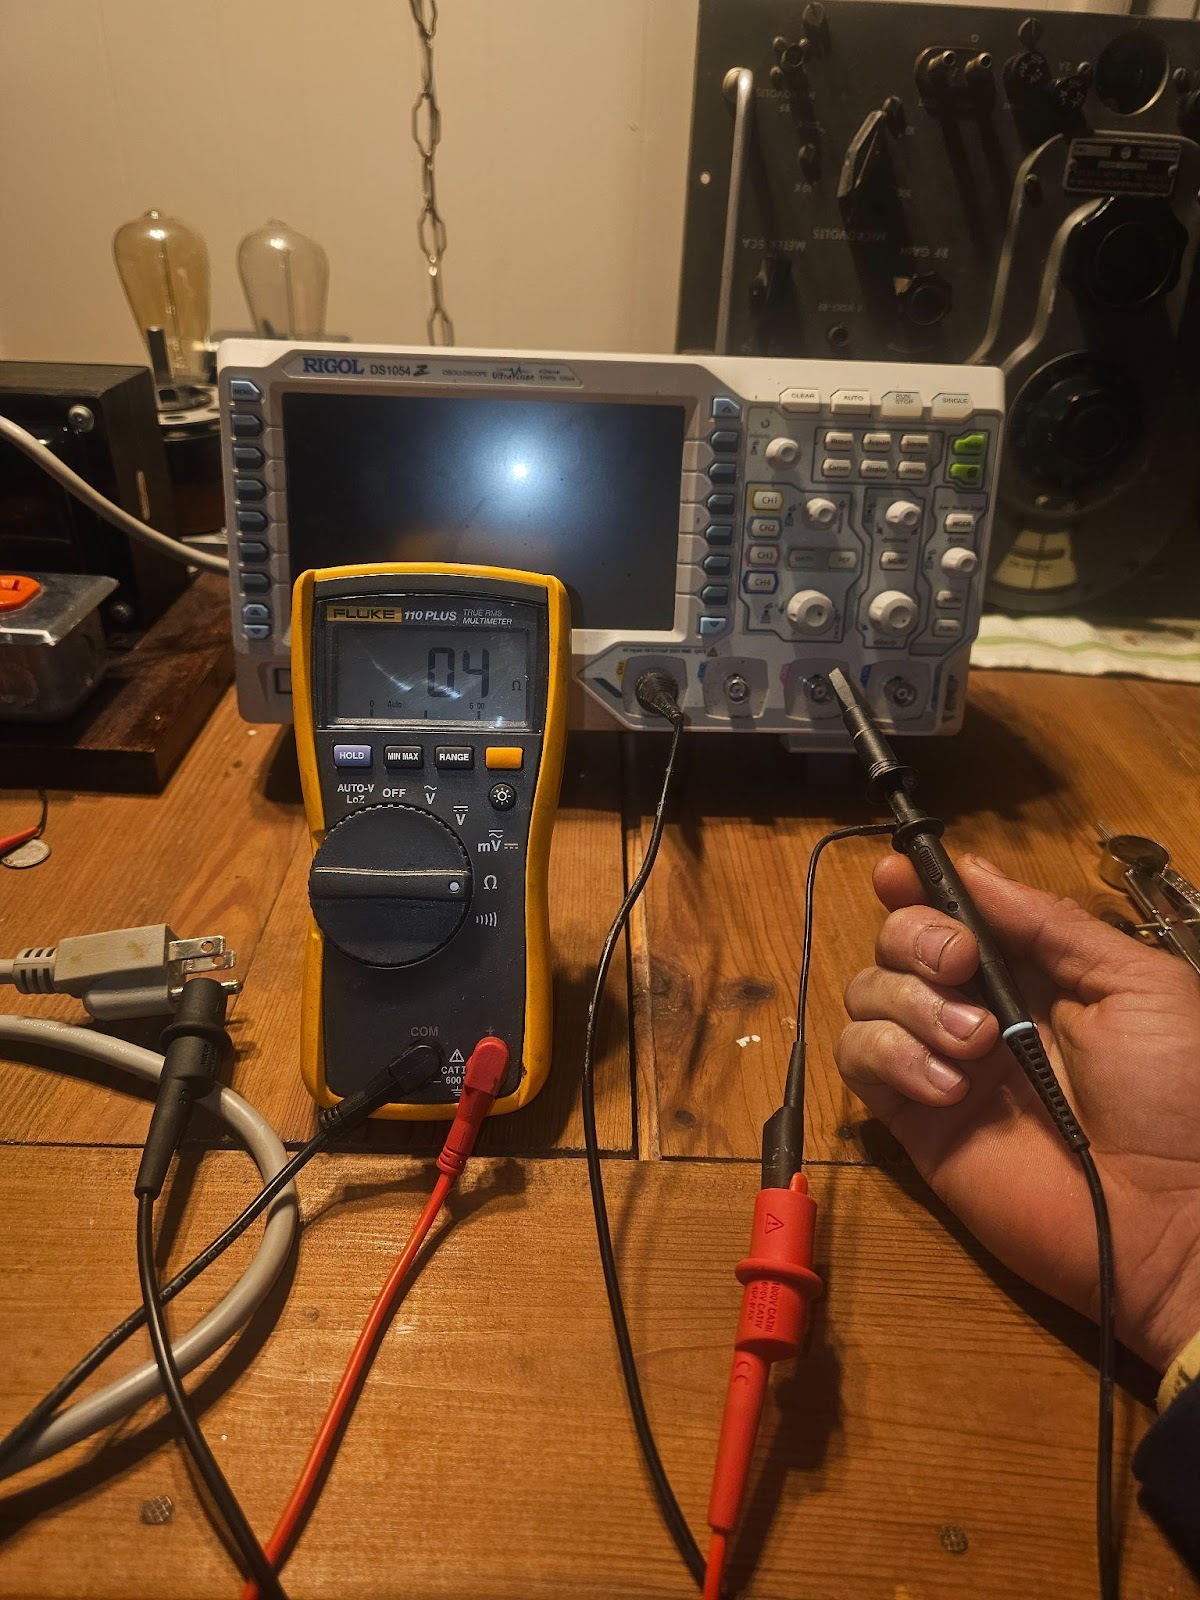
An oscilloscope is NOT like a multimeter! When the oscilloscope is plugged into an outlet, the grounding clamp on the probe becomes bonded to the grounding system in the electrical panel.
If you touch the grounding clamp to any terminal that has voltage on it, you will create a direct short circuit to ground. A short to ground will damage the probe and likely damage you, the oscilloscope, and the device being tested. Always make sure the intended point you wish to use as ground has 0V (checking for both AC and DC) before attaching the ground clamp to the device you are testing. As you can see in the following picture, the grounding clamp connects directly to the ground pin on the power plug:
Waveforms
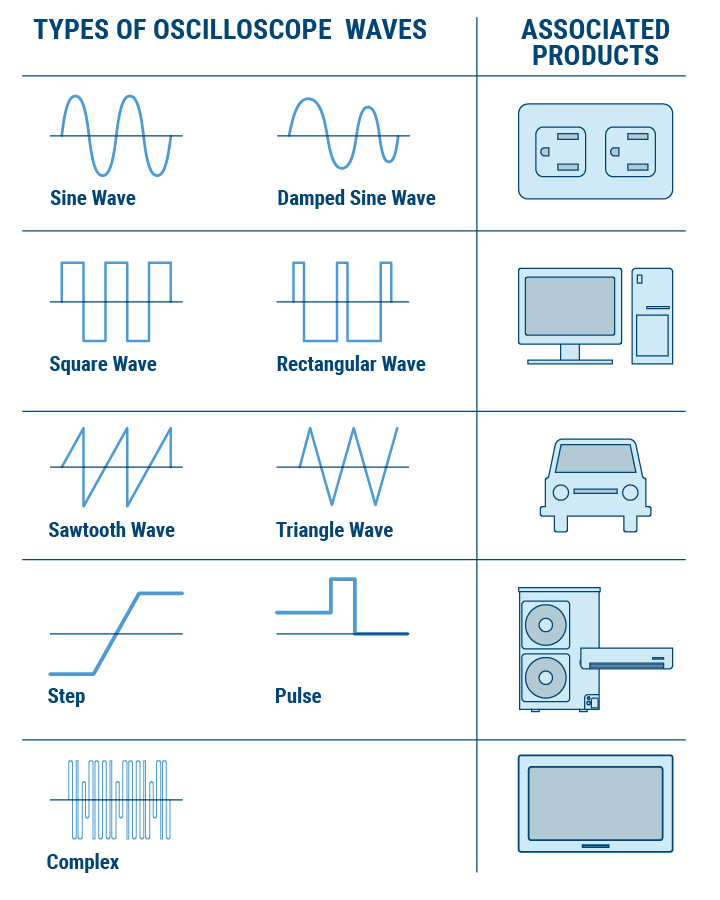
Waveforms or waves come in all shapes and sizes in the modern world. These waves are responsible for carrying out the normal operations of millions of different products. Let’s show you some generic waveforms and their associated products in the real world to help you understand.
Waveforms can explain a plethora of things about a signal, including:
- The minimum and maximum voltages of a signal (over time)
- The frequency of an oscillating signal
- How a circuit changes a signal as it moves through the circuit (via interference or degradation of that signal)
- How the frequency or timing of the signal changes over time (added resistance over time)
- Whether or not a malfunctioning component is distorting the signal (high-resistance shorts or unintentional grounding)
- How much of the signal is noise and whether the noise is changing with time (electrical noise can easily degrade the signal and leave it useless by the time it arrives where it is being sent)
Hopefully, you can see the possibilities of using an oscilloscope for field service by now. As technicians, our main role is problem-solving and troubleshooting. So, why would we not want something as useful as an oscilloscope in our toolbox—especially when dealing with communicating equipment, complex controls, or building management systems?
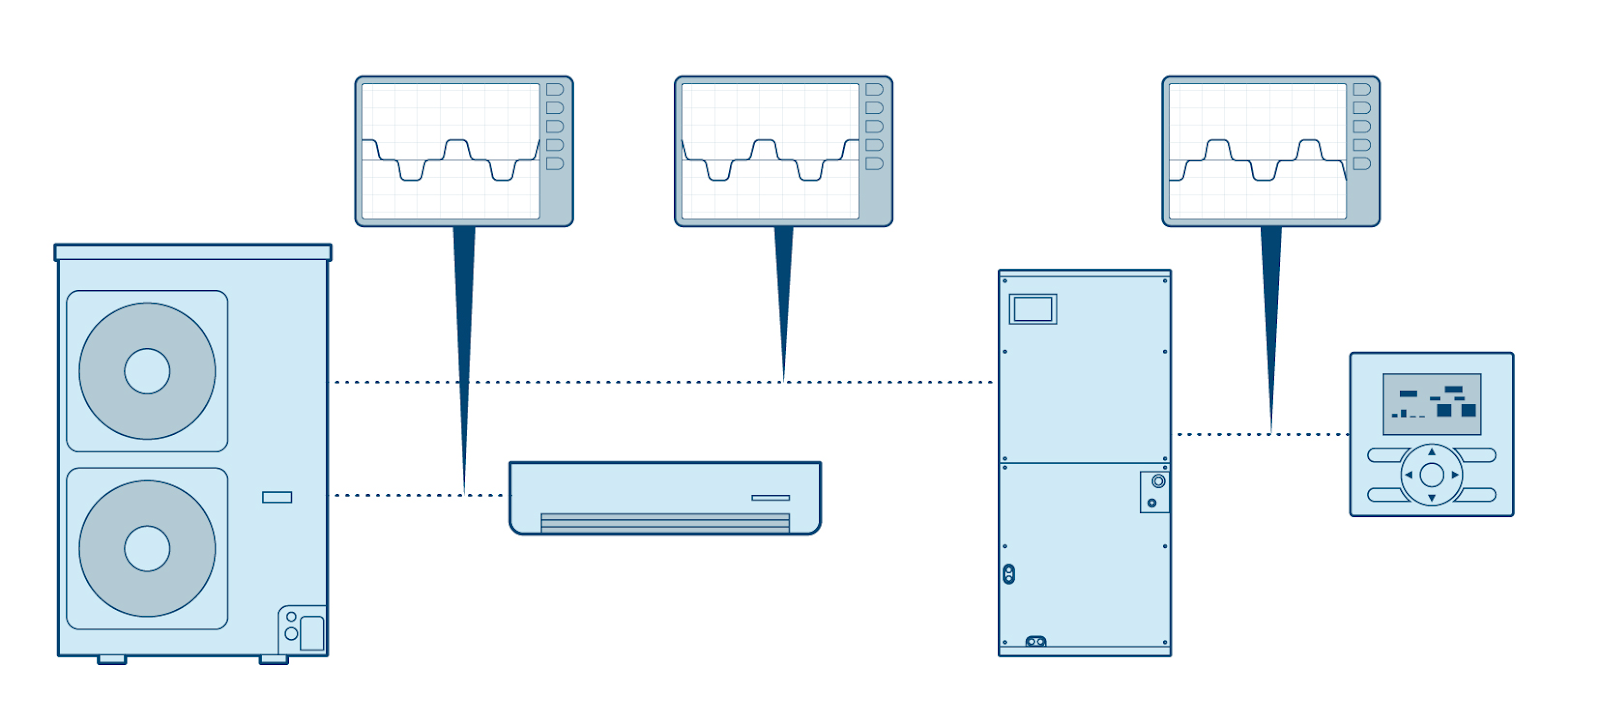
Let’s be honest: real-world signals don’t have a clean shape or a regular, repetitive pattern. In fact, many types of signals are not repetitive at all. You may find that most signals combine several characteristics from two or more of the generic waveforms above. As modern technology has evolved, engineers have designed machines to stuff larger amounts of information into signals, so waveforms have become increasingly complex.
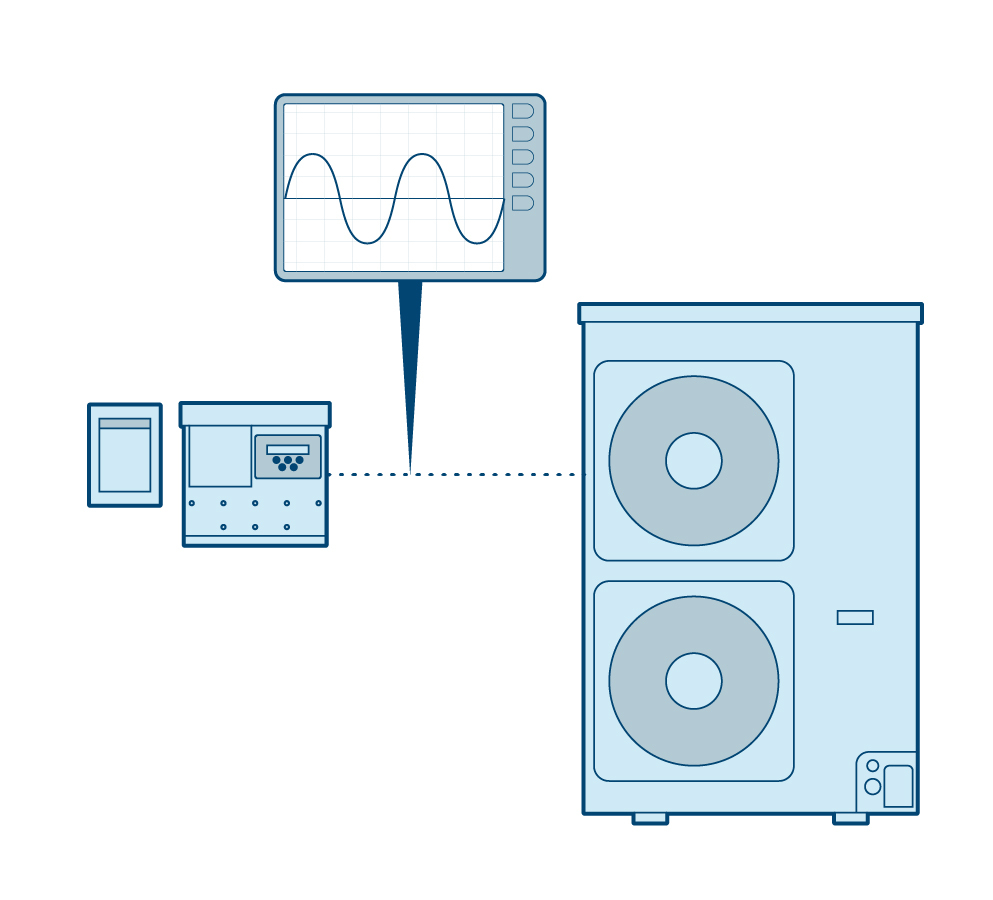
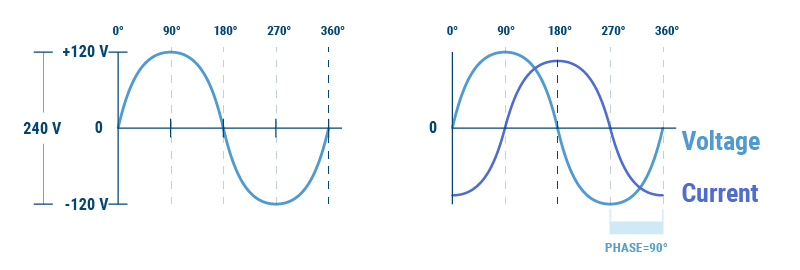
These complexities require a general knowledge of what these signals look like in a controlled environment. A great example is the standard 240-volt alternating current shown below on an oscilloscope. (Yes, you can check the waveform of the high voltage being supplied to your equipment.)
Measurement
We can spend all day learning about the different ways to quantify the characteristics of waveforms. However, let's cover the basic measurements you need to know to get started. Remember, we are measuring these characteristics to judge the quality of signals and possible issues, and these can be measured by looking at the X-Y graph on a scope display.
Voltage is the measurement between two points in a circuit, something we should be familiar with as technicians. We want to measure the voltage from the highest peak to the lowest point valley, which is called peak-to-peak voltage. However, there are other voltage characteristics, including maximum voltage and minimum voltage.
Amplitude is the difference in voltage between two points in a circuit. We measure amplitude starting from zero volts (ground) to the maximum voltage (highest point).
Offset voltage changes the channel’s (input) reference level by adjusting up or down. The average voltage of a waveform can be shifted above or below zero volts. Offset voltage allows you to change the view of the waveform when you zoom in on the signal. You will find that by zooming in, the image of the waveform is no longer on the screen. Offset allows you to adjust the reference point so that the waveform is centered on the screen.
If a signal repeats, it has a frequency. A repetitive signal also has a period, which is the amount of time it takes the signal to complete one cycle. Frequency and period signals are reciprocals of each other; 1/period equals the frequency, and 1/frequency equals the period. Electronic signals cover a wide range of spectrums, from a few cycles per second (hertz), up to billions of cycles per second (gigahertz), or even higher.
It takes some time for a signal to change from a low level to a high level, or vice versa. Rise and fall times are important characteristics of waveforms in digital systems that encode information as high and low voltage levels. For modern digital systems, these times are really short, on the order of billionths of seconds.
Let's show you what an actual oscilloscope screen looks like and the main points you will find on the screen.
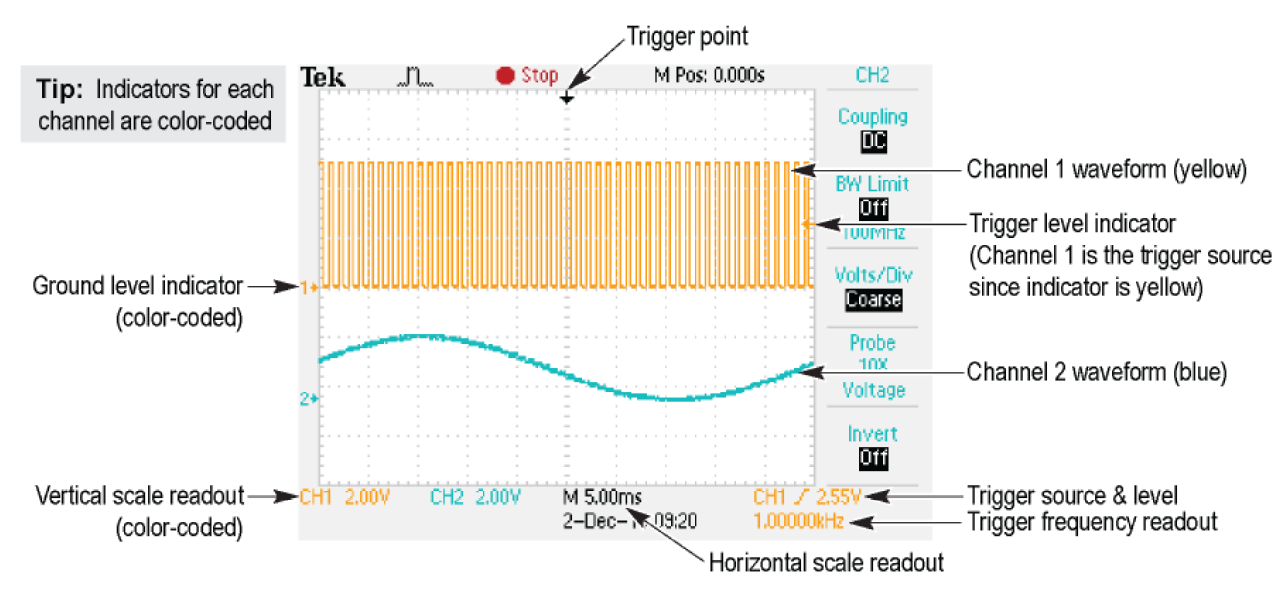
As you can see, oscilloscopes are so much more than fancy TV meters! In the next installment of this 4-part series, we’ll take a look at oscilloscope systems and settings. We’ll use the Rigol DS1054Z as an example because it’s quite beginner-friendly; you can click the link to learn more about it or view the specs ahead of time if you wish.
—Roman Baugh
 Related Tech Tips


Comments
To leave a comment, you need to log in.
Log In